
Vibration Analysis is one of the most core and effective techniques in Predictive Maintenance (PdM). This is because rotating machinery—such as motors, pumps, fans, and compressors—typically exhibits subtle changes in vibration frequency and amplitude long before a catastrophic failure occurs.
The implementation of PdM via vibration sensors follows four critical steps:
1. Data Acquisition: Capturing the "Pulse" of the Machine
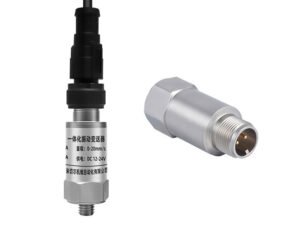
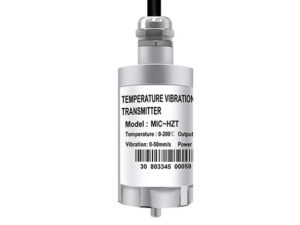
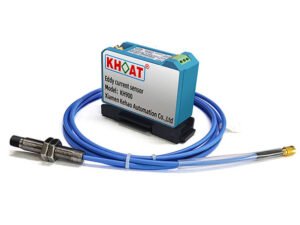
The first step is selecting the appropriate vibration sensors and installing them on critical points (usually the bearing housing, as it most directly reflects the condition of the rotating shaft).
-
Sensor Selection:
-
Accelerometers: The most common choice, ideal for capturing high-frequency vibrations (e.g., bearing damage, gear faults).
-
Velocity Sensors: Best for mid-frequency ranges to detect mechanical defects like imbalance or misalignment.
-
-
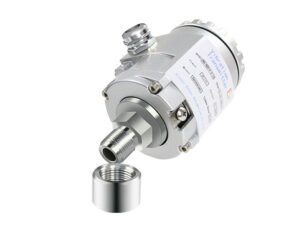
Installation: Magnetic mounts are suitable for periodic inspections, while stud-mounting (bolting) is preferred for long-term, continuous monitoring due to superior data accuracy.
-
Measurement Dimensions: Vibration is typically collected across three axes—axial, radial, and tangential—to obtain a complete motion profile.
2. Signal Processing: Translating "Noise" into "Language"
Raw data collected by sensors is in the Time Domain, which often looks like chaotic noise. We must use mathematical methods to extract meaning.
-
Time-Domain Analysis: Evaluates overall vibration levels (RMS) and peak values. If the total vibration exceeds international standards (such as ISO 10816), it indicates the equipment is in a "sub-health" state.
-
Frequency-Domain Analysis (FFT): This is the core step. Using Fast Fourier Transform (FFT), the complex vibration waveform is decomposed into individual frequency signals.
-
Specific Frequencies Identify Specific Issues: For example, an abnormal peak at 1x the running speed usually indicates "imbalance," while a peak at 2x usually suggests "misalignment."
-
3. Fault Diagnosis: Identifying Latent "Pathologies"
By analyzing spectrum maps using AI algorithms or expert systems, the specific type of fault can be pinpointed:
| Vibration Characteristics | Likely Root Cause |
| Dominant peaks at low frequencies | Mass Imbalance (unbalanced rotor) |
| Peaks at 2x or 3x running speed | Shaft Misalignment or coupling damage |
| Harmonic spikes in high-frequency bands | Bearing wear (pitting or spalling on balls/races) |
| Random, broadband "white noise" | Cavitation (in pumps) or mechanical looseness |
4. Prediction & Decision-Making: Calculating "Life Margin"
This is where PdM differentiates itself from traditional condition monitoring.
-
Trend Analysis: The system monitors the vibration curve over time. If the curve shows exponential growth, a warning is automatically triggered.
-
Remaining Useful Life (RUL) Prediction: Using machine learning models (such as LSTM networks) combined with historical failure data, the system predicts how many days of normal operation remain.
-
Proactive Execution: Maintenance is scheduled during a production gap before the failure occurs (e.g., before a bearing completely seizes), achieving zero unplanned downtime.
Summary
The logic of using vibration sensors for PdM is: Real-time Monitoring $\rightarrow$ Spectral Analysis $\rightarrow$ Fault Localization $\rightarrow$ Trend Forecasting.